Cloud project logs
Page summary:The Logs tab streams your project's live logs in a searchable, filterable table. Click any entry to inspect its full message and metadata.
From the project dashboard, the Logs tab streams the live logs of the project as structured entries you can search, filter, and inspect.
The Logs page is only accessible once the project has a successful deployment and is inaccessible during major environment operations, such as project creation, data transfer, or environment clearing.
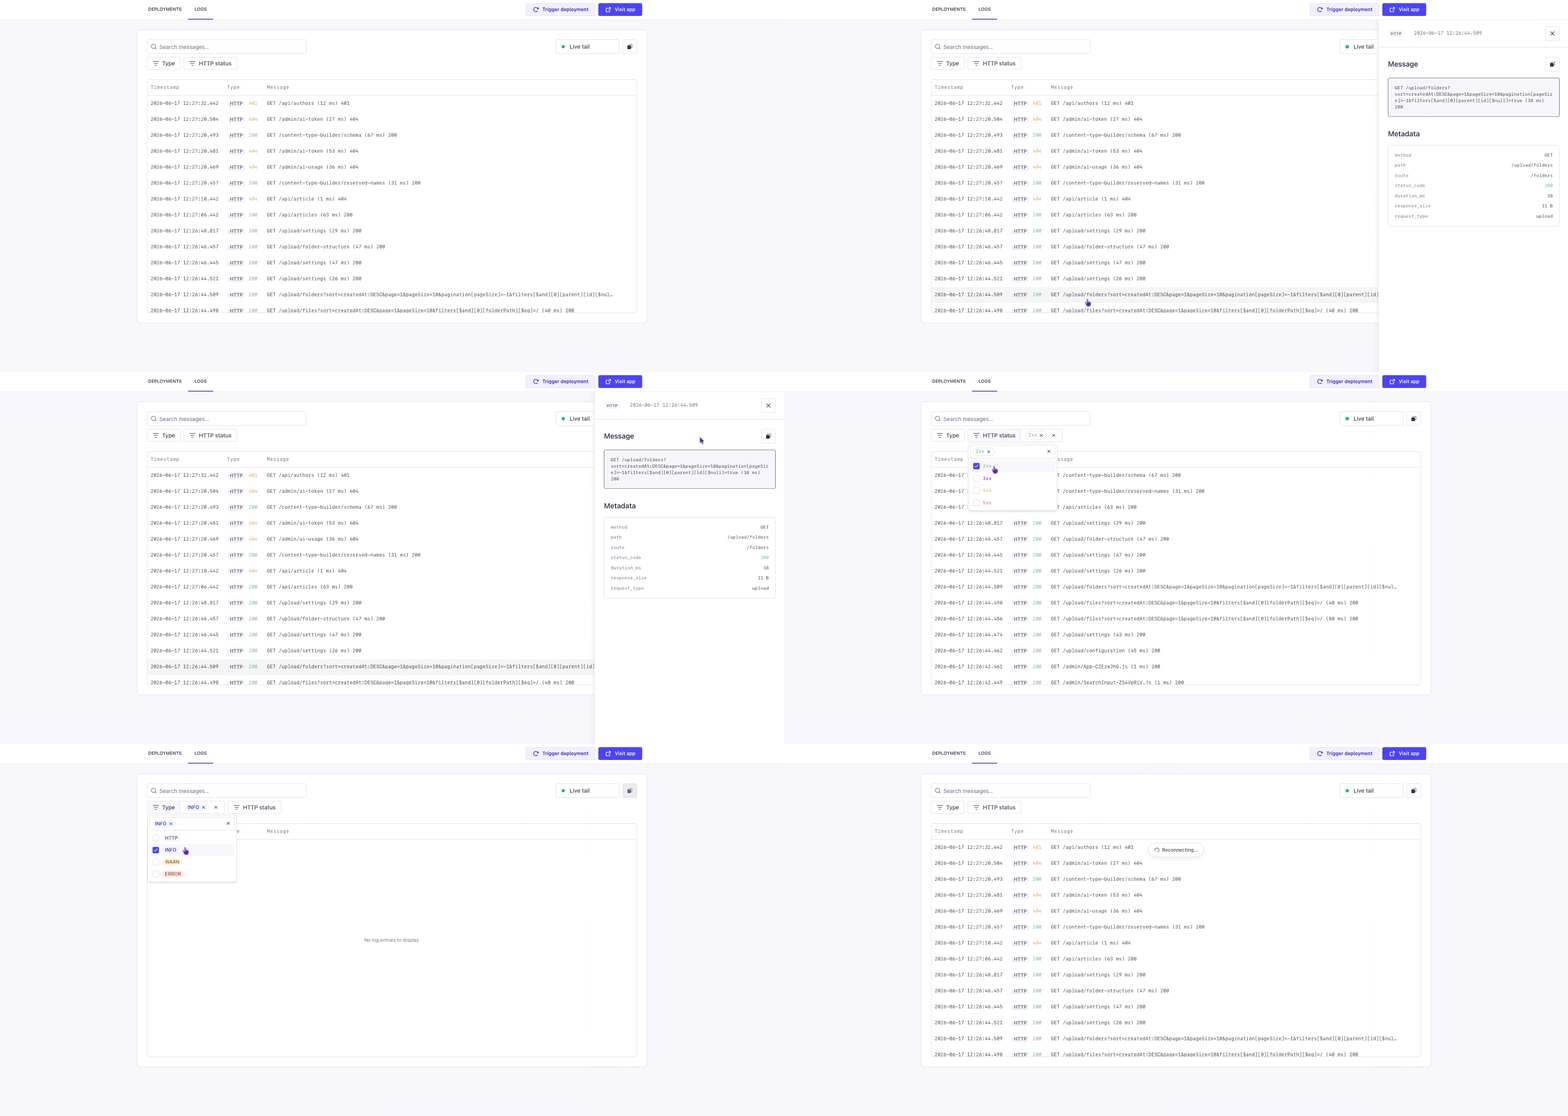
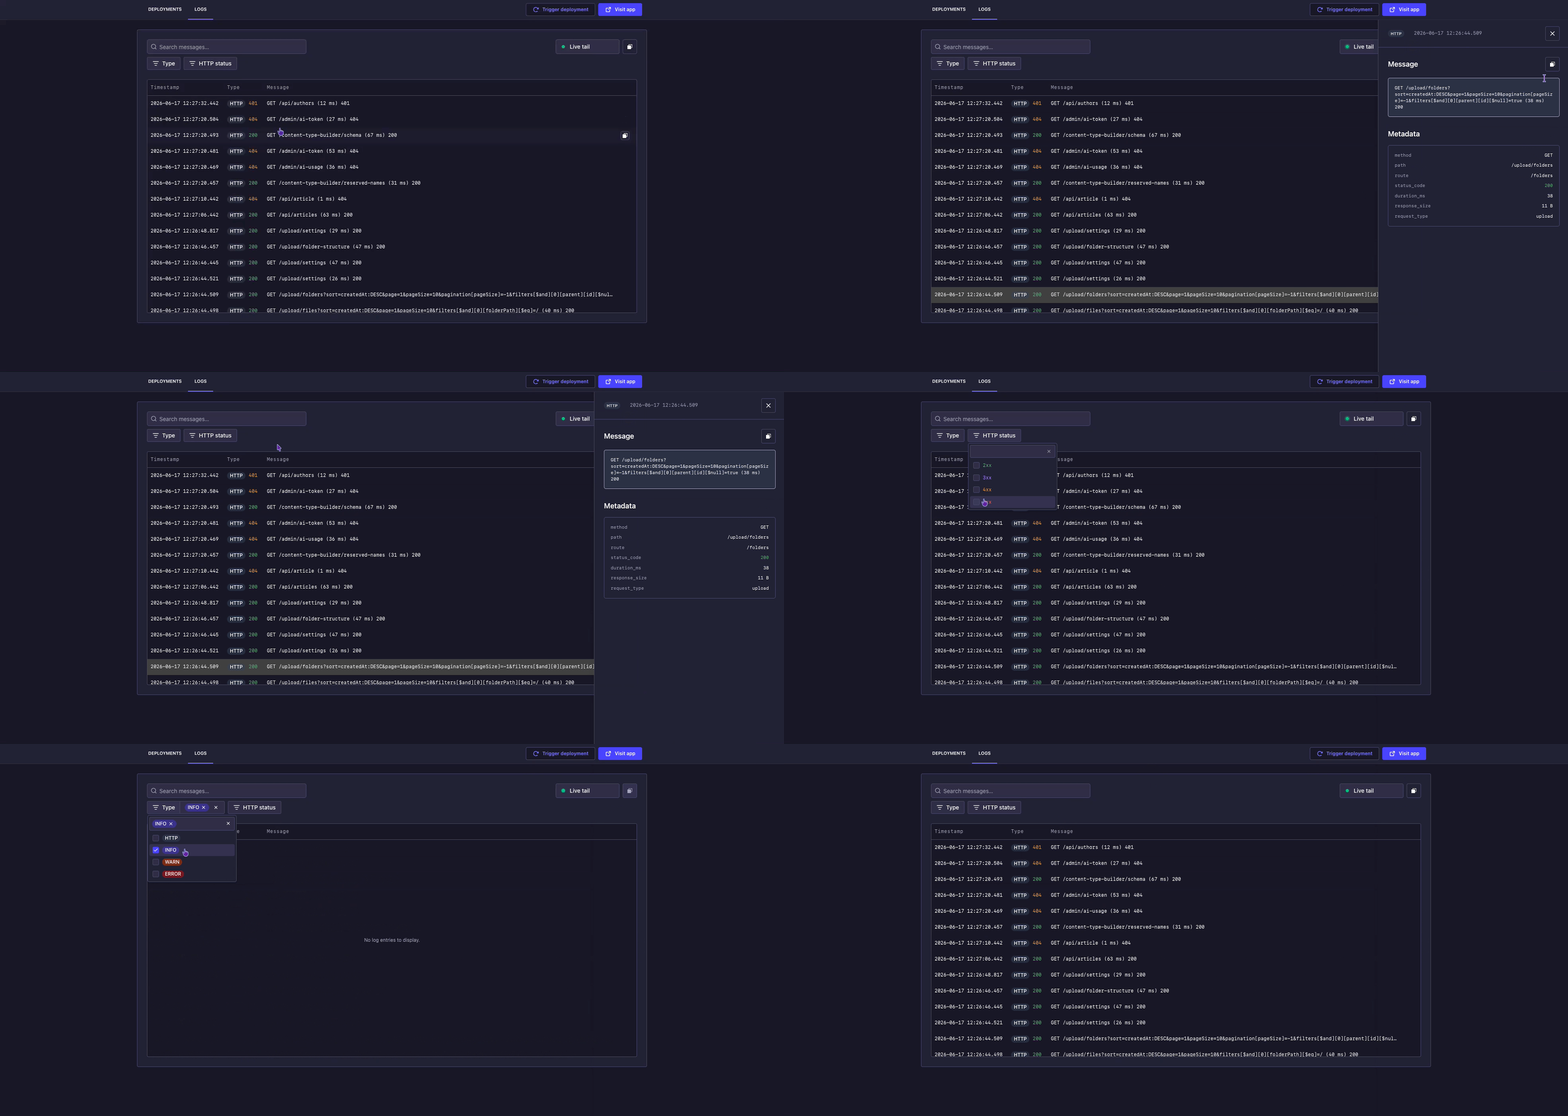
Viewing logs
The viewer follows the live logs stream and auto-scrolls to keep the latest entries in view. Each row shows three columns:
| Column | Description |
|---|---|
| Timestamp | When the log was emitted. |
| Type | The log level, Error, Warning, Info, or HTTP, shown as a colored badge. For HTTP entries, the response status code is shown next to the badge. |
| Message | The log message. Long messages are truncated in the table; click the entry to read the full text in the drawer. |
You can copy a single log line by clicking the copy button visible on row hover, or within the drawer. To copy every entry currently shown in the log viewer, use the copy button in the toolbar instead.
The live log stream is currently limited to the last 15 minutes and capped at 100,000 rows. Historical log visibility is under development.
Inspecting a log entry
Click any log row to open a detail drawer and display the full message and, when available, the Metadata of the log. The Metadata section shows the following information:
| Field | Description |
|---|---|
method | HTTP method (e.g. GET, POST). |
path | Requested path. |
route | Matched application route. |
status_code | HTTP response status code. |
error_type | Error classification, when the entry is an error. |
duration_ms | Time taken to handle the request, in milliseconds. |
response_size | Size of the response. |
request_type | Type of request (e.g. API, admin). |
Viewing historical logs
Use the timeframe selector in the toolbar to switch between live mode and a bounded historical range. The viewer defaults to the last 15 minutes.
Available time ranges depend on your Strapi Cloud plan:
| Time range | Plan availability |
|---|---|
| 15m, 1h, 4h, 24h, 2d, 7d | All plans |
| 14d | ProThis feature is available with a Strapi Cloud Pro plan. BusinessThis feature is available with a Strapi Cloud Business plan. |
| 30d | BusinessThis feature is available with a Strapi Cloud Business plan. |
For all non-live timeframes, a Refresh button appears next to the picker to manually reload the range. In live mode, logs refresh happens automatically.
Searching and filtering logs
You can use the search and filter tools to refine the logs displayed in the viewer. Filters and search combine, so you can, for example, show only HTTP entries with a 5xx status that mention a specific route.
Projects deployed before the structured viewer was introduced display their logs as plain text, without search, filtering, or per-entry metadata. To access the new log viewer, trigger a manual redeployment of the project.
Search bar
Type in the search field to keep only the entries whose message contains your text.
Type filter
Filter by the following log levels:
- Error
- Warning
- Info
- HTTP
Error logs are highlighted in red so they stand out as you scan.
HTTP status code filter
Filter by the following status codes:
- 2xx
- 3xx
- 4xx
- 5xx